Tuesday, March 31, 2009

Randomness Tests for Packed Malware

image In my post Risk Factors for AV Scanning, I discussed a recent patent filing by Kaspersky related to reducing the amount of malware scanning based on various file properties. One of those properties was whether the file is packed or not, since packed files are to be treated more suspiciously than plain unpacked files.

The impact of packed malware is discussed more thoroughly by Tzi-cker Chiueh of Symantec Research Labs in a 2007 presentation on the difficulties in detecting malware, where he devotes 5 slides to the "Packer Problem". Packing adds another dimension to the production of malware signatures which must now account for potentially ten or more layers of packing that obscure the real code that needs to be scanned. Symantec knows of over 1000 different packing programs all of which need to be recognised and stripped off to apply signature scanning.

But is it possible to distinguish between suspicious and actual packed malware using statistical properties of the files without unpacking?

Three authors (Tim Erbinger, Li Sun & Serdar Boztas) have done some interesting research into developing specific randomness tests for detecting packed malware. As it turns out, malware does exhibit a definite randomness signal when the randomness measure accounts for local patterns and structure.

The paper begins by observing that common randomness measures, such as the entropy or other statistical tests, compute a global measure of randomness over all available data and tend to obscure (local) sections of code that may be highly random or highly structured. The figure below shows the distribution of bytes in the program calc.exe before and after packing with UPX. The distribution becomes more uniform after packing, but still far from uniform.

image

The authors proposed several randomness tests that preserve locality (structure or lack thereof), based on constructing a Huffman tree at the byte level of the data (packed file). The Huffman tree algorithm computes codes for each observed byte where more frequent bytes are assigned shorter codes. If the data is random, causing the byte frequencies to be similar, then the Huffman tree codes will be roughly of similar length. Structured data on the other hand will produce codes of quite differing lengths.


image

The authors then sample the data at various bytes positions, collecting the corresponding Huffman codes, and then normalise the code lengths between 0 and 1 (where a higher value means more random). The byte sampling strategies proposed are (1) sample a fixed number of bytes equally spaced in the data (2) slide a window of fixed size across all the data. Below we see the sliding window test applied to the basename binary from UnxUtils before and after being packed with FGS 2.0.

image

image
UnxUtils has 116 binaries ranging in size from a few KB to about 200 KB, and the authors performed a collection of experiments to validate their local randomness tests using 6 well-known packers.
The authors observe that there is a definite characteristic signal of packed files. They go onto to further propose additional tests that can can be used to discriminate between packers.

Returning to Tzi-cker Chiueh and his packer problem, he suggests to workaround packing by Just-in-Time scanning approach which tries to scan a file just before it runs in its unpacked form, and also to consider whitelisting. Perhaps this new local randomness test from Erbinger, Sun & Boztas can help him out.


Related Posts

Wednesday, March 18, 2009

FreeMind and Flash #2

image About a year ago I posted on a new feature of FreeMind that enables maps to be rendered in Flash and accessible via a browser. The FreeMind wiki contains a gallery of such contributed maps on a wide variety of topics.

Under the Technology category I uploaded two maps - the first on issues in designing Publish and Subscribe content distribution systems, and the second was the map behind the research for my post Anonymity on the Edge, a not-so-minor scandal over the exposure of passwords in the edge nodes of the ToR anonymity network.

I have now uploaded the map behind my post on The Positive Trust Model and Whitelists, as well as a map providing a summary of an excellent Cisco report from February 2008 on the risks of remote working (telecommuting), announced here. I hope to make a full post on the report "real soon now".

While I find FreeMind a wonderful tool, I occasionally look at developments in other mind mapping tools. I have been watching XMind for a while and, until recently, it out of my price range at $200. But now XMind has gone open source, available for free (definitely in my price range) with the business model switching to paid hosting and collaboration service for the professional version. I downloaded the free version, a Java Eclipse application, and played around a bit. At least on my machine it was a little clunky, and on first impressions, the additional features did not outweigh the simplicity of FreeMind for me. But you can decide for yourself.

Related Posts


Sunday, March 15, 2009

The Positive Trust Model and Whitelisting

image I recently came across the presentation The Positive Trust Model and Whitelists, by Wyatt Starnes of Signacert, a company that specialises in whitelisting solutions (get the video here). I thought the presentation made some good points, worth repeating here, and extending with other opinions (of which there are many).

Whitelisting, like virtualisation, is a mainframe concept largely forgotten in the era of personal computing, recently rediscovered in our modern IT environment. There are various forms of whitelisting for security purposes, for example in the context of combating email fraud and SPAM, but here we will be concerned with application whitelisting - a method to ensure that only approved applications and their associated executables are permitted to run on a given machine.

John W. Thompson, CEO of Symantec, from his 2008 RSA keynote, supported whitelisting in the face of growing malware diversity (quoted by Starnes)

From where I sit, a few things are very, very, clear. If the growth of malicious software continues to outpace the growth of legitimate software, techniques like whitelisting, where we identify and allow only the good stuff to come in, will become much, much, more critical.

This is a telling statement from the CEO of a company whose cash cow is desktop AV software, the epitome of blacklisting technology. Thompson, and other companies whose business models are firmly based on blacklisting, now agree that whitelisting as a malware defence is an idea whose time has come.

Malware is Increasing

Blacklisting is not really about maintaining a list of prohibited software, but rather maintaining a database of malware signatures to evaluate the state of software through scanning. Software is blacklisted when it is identified to have characteristics identical or similar to known malware. And this is the key point - known malware. The successful and timely identification of malware depends on the rapid identification, production and distribution of updates to signature databases.

Over the last year an inflection point was reached where malware crossed over as being produced in greater quantities than legitimate software. We are heading to the same state of affairs in email where SPAM dominates the number of legitimate messages. Starnes depicted this situation as follows

image

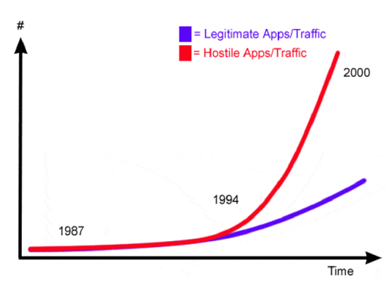
The slide heading for the graphic above is Chase the Infinite or Confirm the Finite? The question asks whether it is a better IT defensive strategy to attempt to screen a wide and increasing variety of malware, or focus on maintaining the current integrity of the known components of your IT system.

A presentation from Martin Fréchette of Symantec Labs, given at RAID 2007, provides more background. First he has a more detailed graph on the number of new threats, which are essentially increasing exponentially.

image

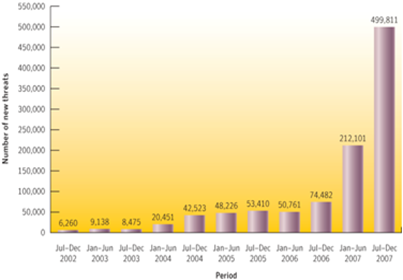
By the end of 2008 there were approximately 1,000,000 known examples of malware, over 2/3 of which had been produced in 2008. That is, 2008 saw more malware produced than all previous years combined. While this sounds alarming, Fréchette notes that part of the reason known malware has been increasing rapidly is due to better detection methods, in particular honeypots and malware sensor networks.

But malware is also increasing due to a change in strategy of the malware industry. Fréchette observes a shift from a mass distribution of a small number of threats to micro distribution of millions of distinct threats, more recently referred to as targeted attacks. Symantec has observed single days where 10,000 new virus strains have been produced, mainly through a technique known as server-side polymorphism, which can automatically regenerate malware strains.

Fréchette notes that the micro distribution strategy is greatly reducing the effectiveness of classic malware signature detection. Even just a few years ago a single signature could be expected to protect 10,000 users whereas today that expectation has dropped to less than 20 users. That is, malware attacks are so specific that signatures serve only to protect small groups of users. Thus signatures must be produced in vast numbers to protect the broader user community.

The Twilight of Blacklisting

image The AV blacklisting industry has reached a point of diminishing returns - the marginal value of producing additional signatures is minimal, but the underlying model can offer no more advice than to simply keep doing exactly that. The AV signature cycle of detect-produce-distribute is being overwhelmed, and the effectiveness of AV solutions (that is, the fraction of known malware that is detectable) is decreasing. Equivalently, the false positive rate is increasing, and consumers are getting less protection than they expect.

There is a significant burden on networks to distribute signatures and also on platforms to perform scanning. Scanning each and every file is neither feasible nor effective. In October last year I posted some remarks on a new patent granted to Kaspersky for a risk-based approach to AV scanning which described criteria (risk factors) for reducing the amount of file scanning. In July last year Robert Vamosi of CNET reported that Norton will also follow a risk-based approach in 2009 with their products, creating a trust index that will be used to judge how often files are scanned. However when I posed the question Would you support less malware scanning to improve user performance? over at LinkedIn the resounding answer was No.

Blacklisting only has a future as a primary security defense if we can actually find ways to do less of it and still retain a low false positive rate. But this sounds like squaring the circle.

Charge of the White Brigade

Enter Whitelisting. Rather than attempting to determine if an arbitrary file (executable) is malicious based on signatures or other criteria, whitelisting creates approved copies of software and simply checks whether the current copy of a binary is the same as its approved copy. Software that is not on the approved list are blocked from running, period. Starnes represents the whitelist production process as follows

image

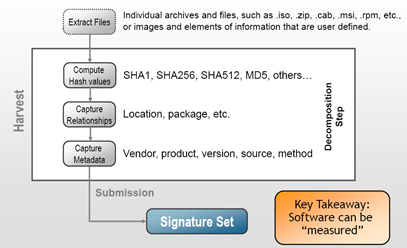
There is a significant reliance on hashing and signatures for trust, where signature here means a PKI signature, not a blacklist signature. Unauthorized change in a file is detected (with high probability) by a change in its associated hash which will in turn cause the signature verification step to fail.

Notice that the hash-sign paradigm of trust here detects changes in software, and does not indicate the absence of security vulnerabilities in software. The point of whitelisting is not to prevent insecure software from being unintentionally loaded onto desktops through an authorized software distribution process. It strives to prevent software (whether secure or no) from being loaded on your desktop in an unauthorized manner. Whitelisting makes sure that the assumed good software stays good, and keeps out the unknown and potentially malicious, software. In essence whitelisting is about maintaining a known software state, and implementing authorized change from one known state to another.

Whitelisting therefore requires a repository of trusted software, which Starnes refers to as a collection of platinum images (you can pick your favourite precious metal or stone).

image

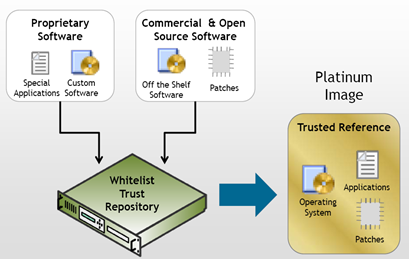
So while blacklists require a signature database and other contextual information for assessing potential malware, whitelisting also requires a repository for proper functioning. The difference is that whitelisting mainly performs comparisons between software to be executed and its respective repository image (a simple check), while the blacklisting database is used to scan and assess the security of the software in question (a more difficult operation).

The size of the whitelist repository grows as a function of the software base supported, while the blacklist database grows in proportion to the amount of known malware - which we have just seen is increasing at an unchecked rate. Chase the infinite or confirm the finite?

While the whitelist model is compelling, in practice it requires significant work to deploy. Assessing and creating the initial list of approved software is a significant task, and would be greatly assisted by existing CMDB implementation efforts in a company. Also, the success of whitelisting is wedded to its tight integration into the software patching and upgrading process. The repository will be in constant flux since software itself is in a constant state of (approved and required) change.

The Way Forward

Not unexpectedly, there is quite a bit of hype around whitelisting, mainly concerning its magical powers to cure security conundrums such as zero-day attacks and endless patching cycles for example. But it will do neither of these two things. Whitelisting does not prevent developers from coding buffer overflows into applications, nor does it prevent malicious attacks from exploiting them. Developers will still require security coding education, and identified vulnerabilities will still require patching.

Nonetheless, the major vendors agree that we will require blacklisting in some form, but whitelisting may become the new leading actor. Bit9 (a whitelist provider) and Kaspersky (a blacklist provider) have teamed up to provide a hybrid consumer solution, where software is scanned only when it is not present on a whitelist. This is not quite whitelisting as intended but it represents the first step in a gradual integration, and more importantly, a way to preserve the blacklisting revenue model. One way or another, whitelists will be coming to a desktop near you soon.

You can find the research used to produce this post as a FreeMind mindmap rendered into Flash here.


Related Posts

Saturday, March 7, 2009

New Birthday Attack on DJBDNS

A new caching bug in the djbdns implementation of the DNS protocol was recently announced by Kevin Day, who is a researcher according to The Register. The full details of the bugs and proof-of-concept code can be found in this 10-page PDF. What Day claims is that djbdns is more vulnerable (that is, requiring less effort on the part of an attacker) to poison its cache. than expected. Day states that cache poisoning may lead to session hijacking, unauthorized information leakage, or other circumstances resulting from users or systems being redirected to systems under the attacker's control.

The weakness is that under normal operation simultaneous queries to the djbdns cache for the same domain can be held open, increasing the likelihood of a response collision. See my post On The DNS Birthday Probability for an overview of this type of attack. Certain configurations of djbdns dramatically decrease the number of requests for the birthday attack to succeed, in fact down from around 2 billion to 16 million. The table below, taken from Day's paper, shows that depending on the configuration of the number of UDP connections accepted, the new attack requires between 18 minutes and 70 seconds for a successful poisoning. The popular BIND DNS server can resist the attack for over a day and a half.

image

Daniel J. Bernstein, a well-known cryptographer and author of the djbdns package, has a standing offer to pay a $1,000 reward to anyone who can find a publicly report a verifiable security hole in his implementation. He may have to get his cheque book out after all.

Related Posts

Thursday, March 5, 2009

Twitter and Extremistan

Back around October last year I signed up to Twitter, at the strong suggestion of my long time friend Terry Jones. He read my post The Wisdom of a Random Crowd of One and tweeted out to his followers, and on to Tim O'Reilly, who in turn tweeted it out to his 17,000 followers (Tim has almost twice that number now). I got 150 visits on one day, when 20 or so would have been expected. You can see the spike in the graph below depicting visitors to my blog.

image

You might call this data point an outlier, since the closest I have got since then is 68 visits in a day, and I think that came from a title promising too much.

That October visit spike reminded me of the fictitious lands of Mediocristan and Extremistan, introduced in Taleb's Black Swan book. Black Swan events are creatures of Extremistan but we mistake their significance because our personal risk-assessing machinery is domiciled in Mediocristan. Here is one of Taleb's examples to explain the difference between these two lands.

Consider a thought experiment where you assemble a sample of a thousand or so people (adults) into a group and measure their height. You would expect most people to between 120 cm and 210 cm (or roughly 4 feet to 7 feet tall), yielding a range of about one metre (3 feet) from tallest to shortest. Still, we might find someone outside this range if we happened to select an NBA player or two, so consider replacing it with 30 cm to 330 cm (roughly 1 foot to 10 feet). It would be quite rare to meet an adult whose height falls outside this range.

image

The average height H of an adult male will be between 160 cm and 185 cm (between 5 and 6 feet), depending on the country, and for sake of argument, let us consider the American average of H = 178 cm (5 feet 9 inches). In this case we see that pretty much everyone's height will fall in the range 0 cm to 2*H cm. So considering a deviation away from the average of size the same as the average covers the full spectrum of heights (0 to 11 and a half feet). And this is what characterizes Mediocristan - the average of the sample is a good guide to the sample itself. We could not add person to the group and expect a big change in the average or a new observation outside our 0 to 2*H interval. The same could be said if we selected weight or shoe size instead of height.

But consider changing this physical attribute of the group to a social attribute, such as net financial worth. Here the average of our sample may be say $1 million USD. But if we added Bill Gates to the sample, with say a net worth of $80 billion USD then suddenly this one observation dwarfs all others - its 8,000 times bigger than the current sample average. The previous observations in the data set are not a good indicator for the existence of the "Bill Gates outlier". Welcome to Extremistan, and as observed by Taleb, practically any social measure exhibits Extremistan properties.

John Robb has created a graphic that shows the main differences between Mediocristan and Extremistan for his post on the topic

image

The last comparison point, Normal (Gaussian) vs. Pareto curves, is a more familiar expression of the Mediocristan vs. Extremistan debate. There is another interesting article on this issue by John Hagel, but my comments will have to wait for another post. For the moment, Twitter is one of my doors into the Extremistan world.

Related Posts

Wednesday, March 4, 2009

The Flap over Twitter

image Twitter is a relatively new Web 2.0 service whose catchcry is to answer the question "What are you doing now?" Let's start with some basics. Twitter is essentially a centralised broadcast system - uers simply sign-up by creating a password-protected account with a username. The username can be anything, and people may use an alias or their real name if personal branding is important.

After you have your account, you can start sending tweets, which are text messages limited to 140 characters. Twitter gathers your tweets on a page in chronological order, so over time your tweets create a diary or log of your activity - what you are doing, where you have been or going, what you are reading, what you are working on, and so on.

image At this point your tweets aren't doing very much. There is a central search function so other people with Twitter accounts can run searches across all tweets, including your own. The next step is to get followers. Followers are other Tweeters who subscribe to your tweets. Each tweet you send is then distributed to all of your followers by Twitter. Tweeters typically use a dedicated Twitter client to aggregate the tweets of all the people they are following, which are presented as a stream of tweets. Many tweets consist of a short observation followed by a link (suitably shortened by a service such as) , so tweets become a links into Web 2.0.

Twitter also allows you to send a direct reply to a tweet, or also do a retweet, which is where you received a tweet from someone you are following and then you send it on to all the people who are following you. Tweet first and ask questions later.

Twitter Usage

Marketing firm Hubspot recently published a report on the state of the TwitterSphere for Q4 2008. They estimate that there are currently 4 to 5 million Twitter users, about 30% of whom are new or intermittent users. From the graph below, Twitter user growth has increased dramatically since March 2007 with 70% of current users joining in 2008.

image

Between 5 and 10 thousand new users are being added each day, which sounds impressive, but keep in mind that Facebook is adding 700,000 new users per day. It was recently estimated that Twitter would take 36 years to achieve the same user base that Facebook has at present.

Nonetheless Twitter boasts a broad user base from Arnold Schwarzenegger, the governor of California, to Stephen Fry, the reader of the Harry Potter series amongst many other things.

Most users follow less than 25 other people, but there are a group of power users who have between 20,000 and 100,000 followers. All but 1% of users have less than 1000 followers.

image

Twitter Risks

Twitter is an unauthenticated service in that you can register for an account merely by creating an unallocated username and supplying a password. If you create a user called Muhammad Ali and start talking about boxing, Twitter won't be checking if you were really rumbling in the jungle with George Foreman in 1974.

An account was recently set up in the name of Internet legend Vinton Cerf, which was eventually suspended by Twitter staff once it became clear that the account a front promoting auction search sites. Security guru Bruce Schneier recently had to post on his blog that

This account "bruceschneier," is not me. This account "schneier," is me. I have never posted; I don't promise that I ever will.

This impersonation problem is not unique to Twitter but people are starting to treat the information received as authoritative. The real point is that enough people are creating data capital in web 2.0 that can be wiped out with a few bad posts - pre-Web 2.o famous people can just shrug it off. Highlights the problem of lack of a general Internet authentication mechanism, and perhaps also reminiscent of cybersquatting with respect to domain names looking for a big sale if the service went well. However in this case there is a better vetting process then with Twitter that is using the honour system.

Recently the first phishing scam emerged on Twitter which directed users to a Twitter look-a-like page registered in China and tried to phish out passwords. The author comments that

This may go without saying, but consider how many third-party Twitter services you use? Seems it’s about time for some kind of verification / validation for applications using the Twitter API - so you can be sure you’re passing your credentials to the right people. I’m guessing this particular phishing scam is not using the API (but there’s no way for a user to properly verify).

Indeed there is a Twitter ecosystem developing which to participate usually requires that you give in your Twitter username and password. The problem of authentication is not just restricted to twitter users but Twitter applications as well.

I have gathered quite a few references to risks facing Twitter and I will post more on this topic later this month.

Related Posts


Monday, March 2, 2009

Two Blogging Milestones

Just a short note to say that my last deposit into the No Tricks blog was post number 50 since September 2007. I had a slow start but picked up in the second half of 2008. The sites statistics from Google Analytics for April 1st 2008 till now are given below. For the binary inclined, the number of pageviews is just a bit bigger than 2^13 .

image

I have also just passed 5,000 visitors, which is encouraging given that I was celebrating my first 3,000 visitors in early December 2008. This is small fry stats as compared to A-list blogs, however there is a pleasing improvement nonetheless. The average number of visits per day now is in the 20 - 30 range for 2009, up from 10 - 20 for Q4 2008 and 10 or less before that.

Here is a cartoon my wife recently sent me, which may account for some of my behaviour of late or even most of last year. You can read more about my reflections on blogging in a cathartic post I made late last year.

image

(image credit).

The Great Laptop Giveaway at US Airports

(May 5th, 2009: This data produced by this study has been questioned).


image In what can only be called a study with staggering results, a report from the Ponemon people published in June 2008, sponsored by Dell, concluded that over 12,000 laptops go missing each week in US airports, over two thirds of which will never be returned. If we assume that each laptop contains at least 20 GB of active business data, then travel is responsible for almost 20 TB of data unexpectedly exiting the corporate information life cycle each week. The data loss tax being levied on travel is getting very high.

The objectives of the study were to (1) understand how US airports handle lost, stolen of missing laptops on their premises (2) assess how business travellers perceive the risks of data loss. Field research was conducted at 106 US airports, 36 of which are considered large (Bravo class) by the FCC. The table below shows the breakdown of laptop losses at the surveyed airports.

image

And where do people lose their laptops? Well, over 70% of the time its at security checkpoints, departure gates or in the restrooms.

image

And what security precautions do travellers use to protect the information on their laptops? As expected, passwords are the winner.

image

The recommendations from the report are very sensible and pragmatic.

  • Label your laptop so it can be identified as yours or the property of your company
  • Allow enough time to get to your flight in a stress-free manner
  • Carry less and think ahead
  • Take appropriate security measures to protect your information
  • Think twice about the information you carry on your laptop
  • Know who to call if your laptop goes missing (know the process, or create one)

Overall, a great report to read and good factual information if you are having trouble getting management support for rolling out a full disk encryption solution for example.

The Wisdom of a Random Crowd of One

(This is a repost as the old link stopped working)

There was a recent excellent post on the RiskAnalysis.Is blog reviewing a debate between security gurus Bruce Schneier and Marcus Ranum on the topic of risk management. The post summarized the debate as something of a stalemate, ending in agreement that the lack of data is the root cause of the unsatisfactory state of IT risk management. The post goes on to make some excellent points about risk and data, which deserves a post of its own to describe and ponder. Here I will make a few points about data, models and analysis.

Data is a representation of the real world, observable but in general difficult to understand. The model is a simplification of reality that can be bootstrapped from the data. Finally, analysis is the tools and techniques that extract meaning from the model, which hopefully allows us to make material statements about the real world. Data, Model, Analysis, Meaning.

Let's take a look at how the famous PageRank algorithm creates meaning from data via analysis of a model. We can all really learn something here.

The Wisdom of a Random Crowd of One

The hero of the PageRank story is an anonymous and robotic random surfer. He selects a random (arbitrary) starting page on the internet, looks at links on that page, and then selects one to follow at random (each link is equally likely to be selected). On the new page, he again looks over the links and surfs along a random link. He happily continues following links in this fashion. However, every now and again, the random surfer decides to jump to a totally random page where he then follows random links once again. If we could stand back and watch our random surfer, we would see him follow a series of random links, then teleport to another part of the internet, follow another series of links, teleport, follow links, teleport, follow links, and so on, ad infinitum.

Let's assume that as our random surfer performs this mix of random linking and teleporting, he also takes the time to cast a vote of importance for each page he visits. So if he visits a page 10 times, then the random surfer allocates 10 votes to that page. Surprisingly, the PageRank metric is directly derived from the relative sizes of the page votes cast by this (infinite) random surfer process.

This seems deeply counterintuitive. Why would we expect the surfing habits of a random process to yield a useful guideline to the importance of pages on the internet? While the surfing habits of people may be time consuming, and sometimes downright wasteful, we probably all think of ourselves as more than random-clicking automatons. However the proof of the pudding is in the searching, and Google has 70% of the search market. So apparently when all of the erratic meanderings of the random surfer are aggregated over a sufficiently long period, they do in fact provide a practical measure of internet page importance. We cannot explain this phenomenon any better than by simply labelling it as the wisdom of a random crowd of one.

Breathing Life into the Random Surfer

The data that can be gathered relatively easily by web crawlers are the set of links on a given page and the set of pages they point to. Let's assume that there are M pages currently on the internet, where M is several billion or so. We can arrange the link information into M x M matrix P = [ Pij ] where Pij is the probability that page Pi links to page Pj (Pij is just the number of links on Pi to Pj divided by the total number of links on Pi).

The matrix P is called stochastic since the sum of each row is 1, which simply means that any page must link to somewhere (if Pi has no links then it links to itself with probability 1). So P represents the probability of surfing (linking) from Pi to Pj in one click by a random surfer. The nice property of P is that P^2 = P*P gives the probability that Pj can be reached from Pi in two clicks by the random surfer. And in general P^N gives the probability that the random surfer ends up on page Pj after N clicks, starting from page Pi.

Can we say anything about P^N as N becomes large? Well if P is ergodic (defined below) then there will exist a probability vector

L = (p1, p2, ..., pM)

such that as N becomes large then

P^N = (L, L, ..., L)^t

This says that for large N, the rows of P^N are all tending to the common distribution L. So no matter what page Pi the random surfer starts surfing from, his long run page visiting behaviour is described by L. We learn quite a bit about the random surfer from L.

As we said above, the long run probability vector L only exists for matrices that are ergodic. Ergodic matrices are described by 3 properties: they are finite, irreducible, and aperiodic. Our matrix P is large but certainly finite. Two pages Pi and Pj are said to communicate if it is possible to reach Pj by following a series of links beginning at page Pi. The matrix P is irreducible if all pairs of pages communicate. But this is clearly not the case, since some pages have no links for example (so-called dangling pages). If our random surfer hits such a page then he gets stuck, and we don't get irreducibility and we don't get L.

To get the random surfer up and surfing again we make the following adjustment to P. Recall that we have M pages and let R be the M x M matrix for which each entry is 1/M . That is, R models the ultimate random surfer who can jump from any page to any page in one click. Let d be a value less than one and create a new matrix G (the Google matrix) where

G = d*P + (1-d)*R

That is, G is a combination of P (real link data) and R (random link data). Our random surfer then follows links in P with probability d or jumps (teleports) to a totally random page with probability (1-d). The value of d will be something like 0.85.

Its should be easy to see that G is irreducible since R enables any two pages to communicate in one clieck. Without going into details, G is also aperiodic since it is possible for a page to link to itself (which is also possible in P as well). So G is ergodic and we can in theory compute the long run page distribution L of the random surfer.

So now that we know L exists for G, it remains to compute it. We have not as yet considered that the number of pages M is several billion and growing. So a direct representation of G as an M x M matrix would require storage on the order of 10^(18), or in the exabyte range (giga, tera, peta, exa). Luckily most pages are likely to have only a few links (say less than 20) and we can represent G using lists which will bring us back into the gigabyte range.

Computing L from G is a large but tractable computation. L is an eigenvector of G and there is an iterative algorithm for computing L from G called the power method. The power method begins with an approximation for L and improves on each iteration. The rate of convergence to the true value of L is geometrically fast in terms of the parameter d. Therefore we can compute the long run behaviour of our random surfer.

The diagram below (available from Wikipedia) shows the PageRank analysis for a simple collection of pages. The arrows represent the link data and the pages are drawn in size relative to their PageRank importance. If we divided the number on each page by 100 this would be our long run probability vector L.

pagerank_graph

What did we learn?

Recall that at the beginning of the post I stated that we need to get beyond pining for data and start to think in terms of data, models and analysis (then meaning). If we now look at the PageRank algorithm we can break it down into

  • Data: Raw page linking represented in P
  • Model: The Google matrix G = d*P + (1-d)*R, a random perturbation of P
  • Analysis: The long run probabilities L of the random surfer.

It could be said that PageRank is one part brilliance and two parts daring. It is not obvious at all that L would produce informative page rankings. However the point is now moot and the wisdom of a random crowd of one has prevailed.

The absence of data has been a scapegoat for years in IT Risk. The real issue is that we don't know what data we want, we don't know what we would do with the data, and we don't know what results the data should produce. These are 3 serious strikes. It seems that everybody would just feel better if we had more data, but few people seem to know (or say) why. We are suffering from a severe and prolonged case of data envy.

In IT Risk we are stubbornly waiting for a data set that is self-modelling, self-analysing and self-explaining. We wish to bypass the modelling and analysis steps, hoping that meaning can be simply read off from the data itself. As if data were like one of those "Advance to Go" cards in Monopoly where we can skip over most of the board and just collect our $200. The problem is that we keep drawing cards that direct us to "Go Back Three spaces" or "Go to Jail".